Chapter 1 Preface
1.1 About
Various
Potential items to cover:
- Aims of the textbook
- Approach taken
- Book level:
- Provide historical context for text analysis
- Develop an understanding of what quantiative research is and how it is approached
- Dive into preparing and conducting text analysis
- Underscore at each level the importance of research goals and project organization
- Chapter level:
- Interactive coding (
learnr) - Concepts and code examples
- Concept and code activities
- Further reading
- Interactive coding (
- Book level:
- Target audience
- Text conventions
This book is about the concepts for understanding and the techniques for doing quantitative language science. Therefore there will be an intermingling of prose and code presented. As such, an attempt to establish consistent conventions throughout the text has been made to signal reader’s attention as appropriate. As we explore concepts, R code itself will be incorporated into the text. This may be a unique textbook compared to others you have seen. It has been created using R itself –specifically using an R language package called bookdown (Xie, 2018). This R package makes it possible to write, execute (‘run’), and display code and results within the text.
For example, the following text block shows actual R code and the results that are generated when running this code. Note that the hashtag # signals a code comment. The code follows within the same text block and a subsequent text block displays the output of the code.
# Add 1 plus 1
1 + 1
#> [1] 2
Inline code will be used when code blocks are short and the results are not needed for display. For example, the same code as above will sometimes appear as 1 + 1.
In terms of prose, key concepts will be signaled using bold italics. Terms that appear in this typeface will also appear in the [glossary] at the end of the text. Furthermore, there are four pose text blocks that will be used to signal the reader’s attention: key points, notes, tips, and warnings.
Key points summarize the main points to be covered in a chapter or a subsection of the text.
In this chapter you will learn:
- the goals of this textbook
- the reasoning for using the R programming language
- important text conventions employed in this textbook
Notes provide a bit more information on the topic or where to find more information.
R is more than a powerful statistical programming language, it also can be used to perform all the necessary steps in a data science project; including reporting. A relatively new addition to the reporting capabilities of R is the bookdown package (this textbook was created using this very package). You can find out more here.
Tips are used to signal helpful hints that might otherwise be overlooked.
During a the course of an exploratory work session, many R objects are often created to test ideas. At some point inspecting the workspace becomes difficult due to the number of objects displayed using ls().
To remove all objects from the workspace, use rm(list = ls()).
Errors will be an inevitable part of learning, but some errors can be avoided. The text will used the warning text block to highlight typical pitfalls and errors.
Hello world!
This is a warning.
Although this is not intended to be a in-depth introduction to statistical techniques, mathematical formulas will be included in the text. These formulas will appear either inline \(1 + 1 = 2\) or as block equations.
\[\begin{equation} \hat{c} = \underset{c \in C} {\mathrm{argmax}} ~\hat{P}(c) \prod_i \hat{P}(w_i|c) \tag{1.1} \end{equation}\]
test citation (Gould, 2017) and grouped citations (Gould, 2017; Jockers, 2014)
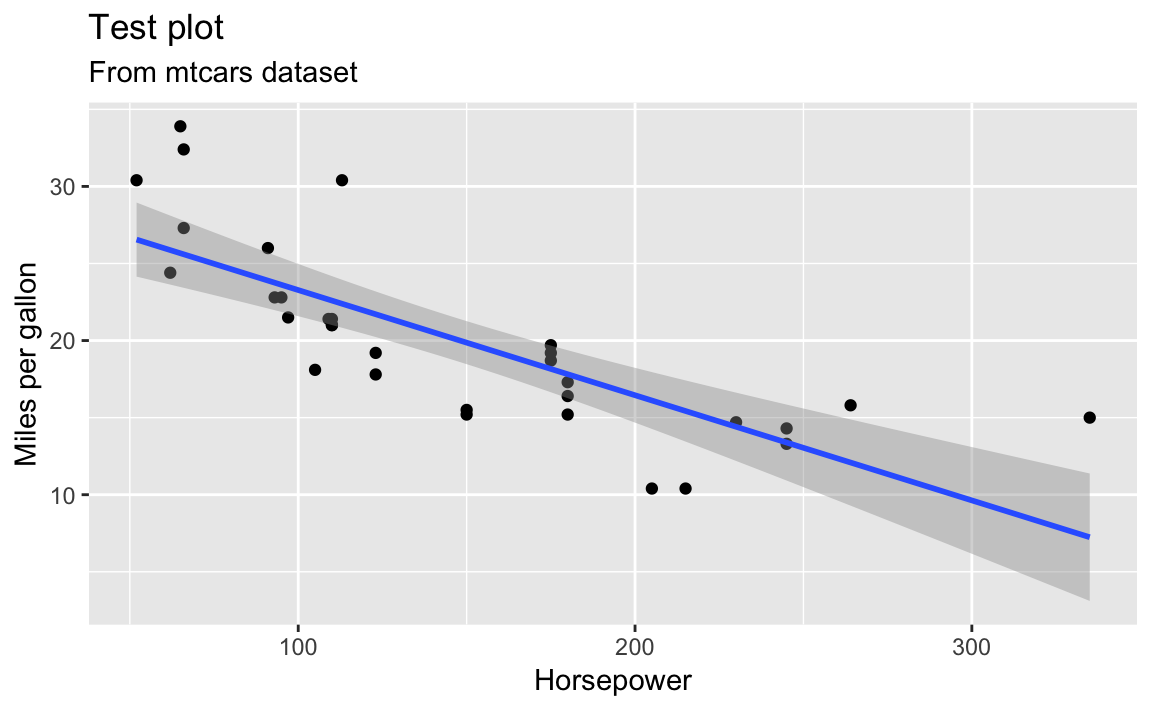
test figure here …
library(ggplot2)
ggplot(mtcars, aes(x = hp, y = mpg)) + geom_point() + geom_smooth(method = "lm") +
  labs(x = "Horsepower", y = "Miles per gallon", title = "Test plot",
    subtitle = "From mtcars dataset")
Figure 1.1: Test plot from mtcars dataset
… as we see in Figure 1.1.
test table in Table 1.1.
knitr::kable(head(iris, 20), caption = "Here is a nice table!",
booktabs = TRUE)| Sepal.Length | Sepal.Width | Petal.Length | Petal.Width | Species |
|---|---|---|---|---|
| 5.1 | 3.5 | 1.4 | 0.2 | setosa |
| 4.9 | 3.0 | 1.4 | 0.2 | setosa |
| 4.7 | 3.2 | 1.3 | 0.2 | setosa |
| 4.6 | 3.1 | 1.5 | 0.2 | setosa |
| 5.0 | 3.6 | 1.4 | 0.2 | setosa |
| 5.4 | 3.9 | 1.7 | 0.4 | setosa |
| 4.6 | 3.4 | 1.4 | 0.3 | setosa |
| 5.0 | 3.4 | 1.5 | 0.2 | setosa |
| 4.4 | 2.9 | 1.4 | 0.2 | setosa |
| 4.9 | 3.1 | 1.5 | 0.1 | setosa |
| 5.4 | 3.7 | 1.5 | 0.2 | setosa |
| 4.8 | 3.4 | 1.6 | 0.2 | setosa |
| 4.8 | 3.0 | 1.4 | 0.1 | setosa |
| 4.3 | 3.0 | 1.1 | 0.1 | setosa |
| 5.8 | 4.0 | 1.2 | 0.2 | setosa |
| 5.7 | 4.4 | 1.5 | 0.4 | setosa |
| 5.4 | 3.9 | 1.3 | 0.4 | setosa |
| 5.1 | 3.5 | 1.4 | 0.3 | setosa |
| 5.7 | 3.8 | 1.7 | 0.3 | setosa |
| 5.1 | 3.8 | 1.5 | 0.3 | setosa |
1.2 Setup
Potential items to cover:
- R and RStudio
- Why program? Why R?
- Git and GitHub
1.3 Resources
Potential items to cover:
- Getting help
- …